Meeting Information
Date: 7/27/2016
Time: 2pm
Location: JC 311D
Agenda
Event Tracking Issues
Due to our custom code, pageviews are being tracked across multiple analytics properties . However, events are only being tracked to the default analytics property. Would GTM solve this?
Roll-Up Review/Update
Roll-Up Hostnames
New hostnames appearing in the roll-up since last meeting:
| Hostname | Business Unit | Comments |
|---|---|---|
| 129.174.125.205 | – | – |
| blackboard.gmu.edu | ? | – |
| cheusecenter.gmu.edu | CHSS | – |
| chss.gmu.edu.googleweblight.com | CHSS | Google Web-Light transcoded version of website |
| communication.gmu.edu.googleweblight.com | CHSS | Google Web-Light transcoded version of website |
| courses.gmu.edu | ? | – |
| cvpa.mason.contentpeak.net | ? | what is this? |
| dance.gmu.edu | CVPA | – |
| datalab.gmu.edu | COS | – |
| erf.sbb.spk-berlin.de | – | – |
| localhost | – | – |
| masoncoaching.gmu.edu | ? | – |
| masongrad.hobsonsradius.com | EM | Hobsons Radius CRM (graduate) |
| mymason.gmu.edu | ? | – |
| oscar.gmu.edu.googleweblight.com | ? | Google Web-Light transcoded version of website |
| pda.baidu.com | ? | – |
| schar.gmu.edu | SPGIA | New domain for spgia.gmu.edu |
| tsdauth.gmu.edu | ? | – |
| vse.preprod.gmu.edu | – | VSE preprod website |
| www.gmufootball.gmu.edu | ? | – |
| www.wonder-tonic.com | – | – |
Notes
I would NOT recommend assigning a business unit to preprod websites. Although they are legitimately part of the relevant business unit, they are pre-prod and not intended for public viewing. (Ideally pre-prod sites would not event implement the GA code to avoid muddying the data.)
I WOULD recommend assigning the relevant business unit to Google Web-Light hits. They do represent real requests. More info about google web light…
Note: I have assigned www2.gmu.edu the business unit: “Mason Core” so that it would appear in the Business Unit report. (Reports using a custom dimension will only show rows for which there is data for that custom dimension.)
List of Views
Existing views in the Mason ‘roll-up’ analytics property:
| View name | Website URL | Effective date | Bot filtering? | Filters | Exclude URL query parameters? |
|---|---|---|---|---|---|
| chss: _unfiltered (2006-12-01) | chss.gmu.edu | 2006-12-01 | – | none | none |
| gmu: _test view (2015-02-04) | gmu.edu | 2015-02-04 | – | none | none |
| gmu: _unfiltered (2016-07-27) | gmu.edu | 2016-07-27 | – | none | none |
| gmu: roll-up 1.0 (2012-02-21) | gmu.edu | 2012-02-21 | – | Include Hostname in Request URI | utf8 |
| gmu: roll-up 1.5 – off-campus only (by IP address) (2015-10-20) | gmu.edu | 2015-10-20 | – | Include Hostname in Request URI Exclude On-Campus Traffic By IP Address |
none |
| gmu: roll-up 1.5 – off-campus only (by ISP) (2015-10-20) | gmu.edu | 2015-10-20 | – | Include Hostname in Request URI Exclude On-Campus By ISP Organization |
none |
| gmu: roll-up 1.5 – on-campus only (2015-10-20) | gmu.edu | 2015-10-20 | – | Include Hostname in Request URI Include only ISP Organization george mason university |
none |
| gmu: roll-up 2.0 – all traffic (2015-12-08) | gmu.edu | 2015-12-08 | + | Include Hostname in Request URI Lowercase: Request URI |
utf8, _ga |
| gmu: roll-up 2.0 – off-campus only (2015-12-08) | gmu.edu | 2015-12-08 | + | Include Hostname in Request URI Lowercase: Request URI Exclude On-Campus By ISP Organization |
utf8, _ga |
Notes
View naming conventions
Website’s URL (according to view settings)
Effective date (date view began receiving data)
Note: Google Analytics launch date was Nov. 14, 2005.
Bot filtering
Filters: Review filters
Include Hostname in Request URI: Re-writes the request URI to include the hostname. This allows us to disambiguate URLs from multiple websites.
Lowercase: Request URI: Converts the entire request URI to lowercase, to avoid indexing request URIs differently if they are request in mixed- or upper-case.
Exclude On-Campus Traffic By IP Address: Excludes hits from a specified range of IP addresses (which equates as closely as possible to on-campus traffic). See Roll-up 1.5 view comparison.
Exclude On-Campus By ISP Organization: Excludes hits originating from the ISP “george mason university” (which equates generally with on-campus traffic).
Include only ISP Organization george mason university: Include only hits originating from the ISP “george mason university” (which equates generally with on-campus traffic).
Excluded query parameters:
utf8: needed for CHSS, CommonSpot?
_ga: Google Linker plugin – ok to filter in analytics views
The official recommendation is to filter any parameters which don’t influence the content that is displayed.
Custom Reports
- Dimension: Hostname > Page – This report is an easy way to see what domain names are contributing data to an analytics roll-up property. Drilling-down on hostname will show you only the URLs that are being tracked on the given hostname. See pie chart.
- Dimension: Business Unit > Hostname > Page – This report will allow you to see traffic grouped by our custom dimension “Business Unit”. This report therefore shows aggregate traffic to an entire academic or business unit, at least as categorized. Drilling down on a business unit will show the hostnames assigned to this buisness unit. This is a good way to ensure your domain names are being tracked and grouped appropriately. Drilling-down on the hostname will show you all URLs being tracked on a given website. See pie chart and compare to previous. Review note about Mason core.
- Dimension: Service provider – This report shows which service providers (ISPs) are responsible for visitors to the website. This view was useful for testing the on-campus vs. off-campus analytics views. Example.
- Event: Outbound links from exit page – (View in www2.gmu.edu property.) This report shows outbound links that people are clicking on by page. First dimension is exit page, ensuring that the outbound link click is the last click in that session and thus truly came from that page. (Simply using ‘page’ would catch any events for any users who visited the given page at any time in their session.) It then drills-down to view specific clicks by page. The top-level shows all outbound link clicks from the given page. Clicking on the page will break out the individual links.
- Campaign: Admissions UG > Campaign > Landing Page – (View in www2.gmu.edu property.) This report shows all visits to the site with a source /medium of “admissions connect / email”. It then drills-down to display individual campaigns. And further drill-down to view the specific landing pages resulting from our campaign-tagged links.
Review naming conventions.
Admissions Campaign Tagging
Admissions has started tracking marketing campaign link-clicks.
General Info on Campaign Tagging
We are focused on emails, but campaign tags could also be used in other media such as printed materials, social media, etc. Note that in the case of printed materials, you would generally use simpler ‘vanity’ URLs in print (easier for the user to type-in) which would then redirect the user having added the appropriate campaign tags as described below.
To track the performance of your email marketing campaigns, you need to append special campaign parameters to the end of your link URLs.
The relevant parameters are:
- Medium (utm_medium in the URL) = what is the medium in which the link is found (e.g – print, email, social, etc.)
- Source (utm_source in the URL) = where is this particular link found (e.g. – facebook, twitter, connect, etc. (not directly applicable to emails, but…))
- Campaign (utm_campaign in the URL) = the name of the particular campaign the link is a part of
- Content (utm_content in the URL) = typically used to differentiate ad content, but it can be used for other things.
So, for example, a link we may use in emails is https://www2.gmu.edu/admissions-aid/ (the admissions and aid landing page).
With campaign tags, this full link would instead be: https://www2.gmu.edu/admissions-aid/?utm_medium=email&utm_source=admissions connect&utm_campaign=nova&utm_content=inquiry
Of course these parameters should not be visible to the user. The clickable text may just say “Click Here” (or the like) but behind-the-scenes the full URL would include all of these parameters.
A few points to note:
- For consistency, the values used in the URL should always be lowercase.
- A plus sign (+) in a parameter value will show up as a space in the google analytics reports. If a space is needed, you should use this instead of a normal space character. (A normal space will show-up as %20 in the URL.)
- All links used in emails that you intend to track (which may be all of them) should have these additional parameters. Links not using these parameters will typically be indistinguishable from ‘direct’ web traffic.
- These parameters should be used consistently. If you use them with different capitalization, spacing, spelling, etc. they will appear as different campaigns – so consistency is key.
- The source parameter is less relevant in the case of medium=email. But…
It is very important that you define what campaign tag values you will be using – and stick with them. Forgetting to use the link parameters, using them inconsistently, or mistyping them will affect your data and our ability to track your campaigns. For this reason, I would suggest adding as a standard procedure that every email and all links within are reviewed before the email is queued/sent to make sure that all links are tagged appropriately.
A big question to answer how broadly/narrowly to name your campaigns.
For example:
If we defined our campaigns too narrowly as “Fall 2016 – Northeast – Initial Communication 2016-06-07” we would learn just about the performance of this one email to this one population, but would miss out on seeing larger patterns in our campaign strategy (i.e. missing the forest for the trees).
If we defined our campaign too broadly as “Fall 2016”, we would see data on all communications lumped together in one ‘bucket’ and would miss a lot of information as to how particular lines of communications or particular populations were performing within that (i.e. missing the trees for the forest).
Undergraduate Admissions Implementation
Here are the specifications of our specific campaign-tagging implementation:
- Medium = email (obviously)
- Source = admissions connect (indicates that this email came from admissions undergraduate)
- Campaign = northeast, south, midwest, west, nova, ova. We send indentical emails (but with different link parameters) separately to our different regional populations.
- Content = inquiry, applied, admit. This indicates the phase of the process of which this email communication is a part.
When we start tagging graduate-level communications, the source parameter will be “admissions radius”.
For academic units, we would recommend that the source parameter include both the name of the academic unit as well as the program name (where applicable).
Annotations
Note: roll-up 1.0 and 2.0 views are annotated.
Annotations help you answer the why and how in your data analysis (and maintain historical records explaining anomalies in data).
Examples of items to annotate:
- Website launches
- Major website content or design changes
- Website technical/tracking issues
- Marketing campaigns
- Industry developments (ex: google mobile search changes)
- Competitor activities
You can create and add annotations directly from reports or more quickly via the admin interface.
Annotations via Google Analytics Reporting Interface
Navigate to any of your Google Analytics overview reports. An example is shown below:
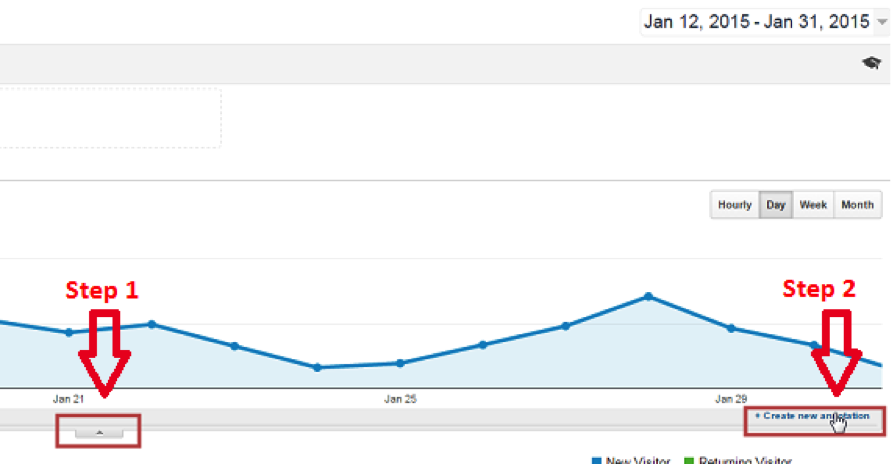
Select the small arrow in the middle and click on the “create new annotation” link on the right.
- Click the “star” if you want to save this annotation as one of your favorite ones. It’s easier to find your most important annotations at a later time.
- Click the correct date for your annotation (it’s not possible to add annotations for future dates).
- Choose between shared and private; most often, you will want to select “shared.” Then, other people who have access to the same reporting view can see the annotation as well.
- You can use up to 160 characters (including spaces) for your annotation.
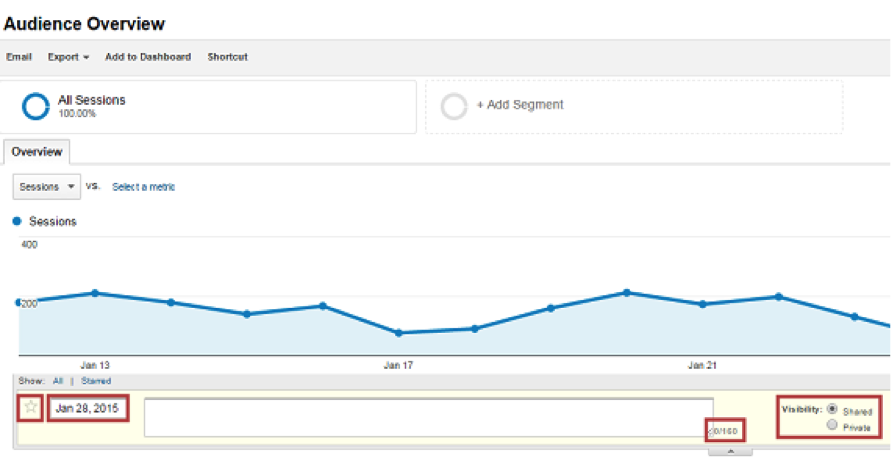
Annotations via Google Analytics Admin Interface
Navigate to the admin interface and click on “Annotations” (under the Personal Tools and Assets menu):
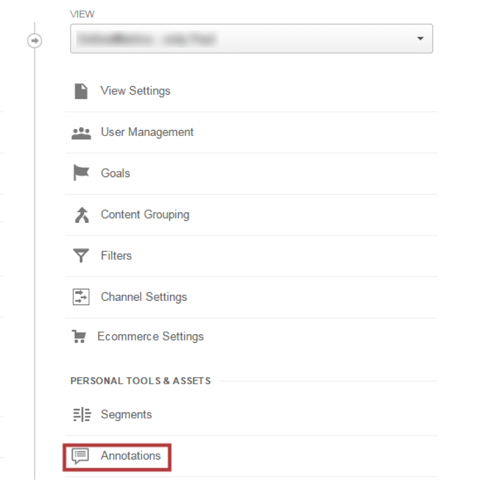
Click the new annotation link on the next screen.
There is no API support, unfortunately.
Review existing roll-up annotations.
Intelligence Events
In Google Analytics, there are two types of intelligence events:
- Automatic alerts
- Custom alerts
Automatic alerts are created for you:
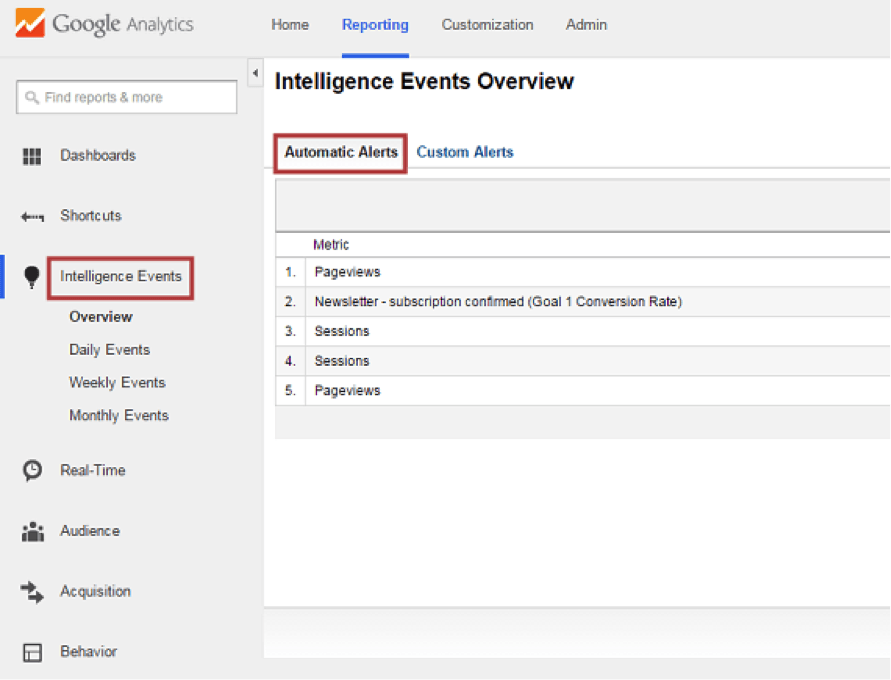
Custom alerts need to be created by you.
You need to set them up via the admin interface; it’s under the Personal Tools and Assets menu.
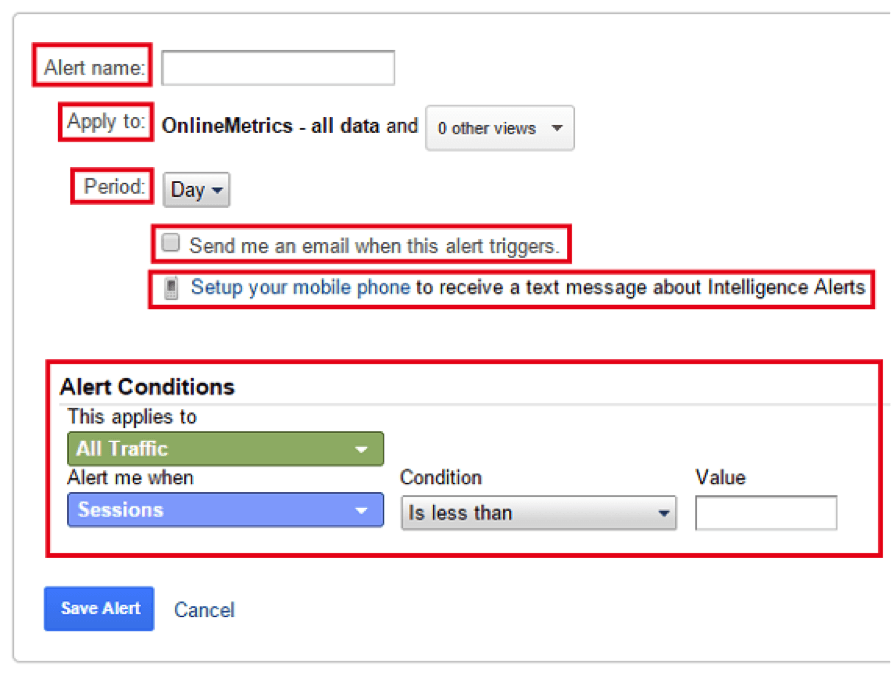
There are a number of things to set up:
- Alert name: an easy name to remember
- Apply to: select one or more reporting views
- Period: day, week, or month
- Email alert: you can include other people who have access to this view
- Mobile phone alert: only works if you live in the United States
- Applies to: the segment you like to apply the alert to
- Alert condition: specify when the alert needs to be triggered
Four recommend custom alerts:
- Traffic level
- Site Usage
- (Macro) conversion/rate level
Motion Charts
Use motion charts to visualize data. Motion charts can be a great help in reviewing data that is not obvious from a snapshot or time-range average. Great for seeing patterns in data that change over time.
For almost every report, you can choose use motion charts:
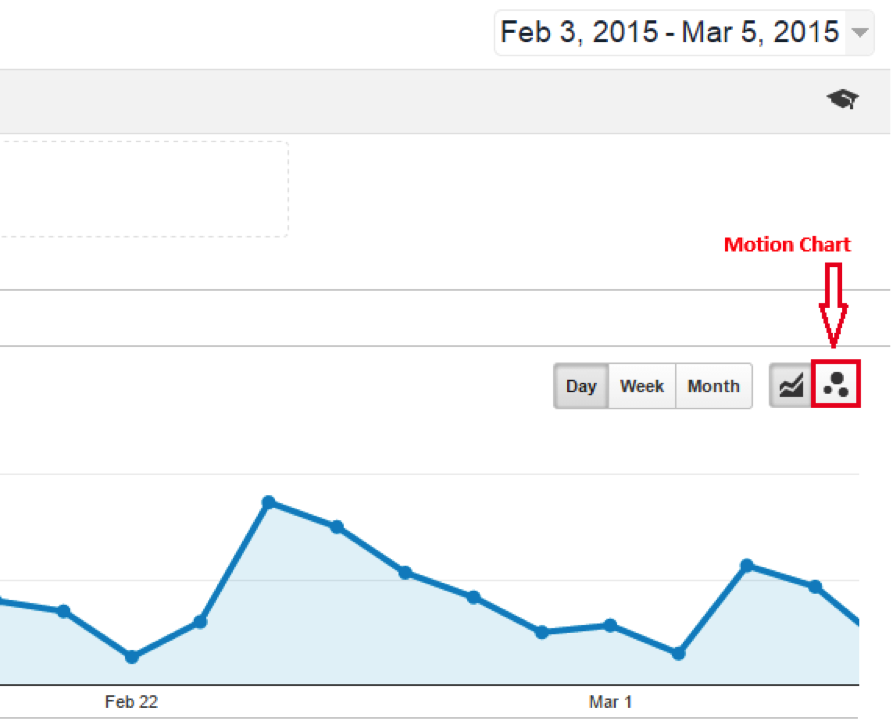

You can visualize up to 5 metrics at once: timeline (time), x-axis (custom), y-axis (custom), color (custom), and size (custom). You can only use metrics shown on the report.
Hit the play button on the left, and you can even see how the data and segments evolve over time.
Can display data as scatter plot (best, IMO), line graph, or bar graph.
Example 1: Campaigns
View: www2.gmu.edu
Report: custom admissions campaign report
Time range: July 2016
Y-axis: pages/session
X-axis: sessions
Color: bounce rate
Size: average session duration.
Note overall data.
Show data details on hover, selecting items, trails.
Note multiple dimensions on drill-down.
Show comparing two dimensions: nova and northeast
Example 2: Channels
View: Roll-Up 2.0 off-campus
Report: Channels
Time range: July 2016
Y-axis: pages/session
X-axis: sessions
Color: bounce rate
Size: same size
Select: Direct, Referral, Organic Search
Can only select dimensions in sidebar if not using size metric (for some reason).
Note that direct has fewer pages per session (bookmarks?).
Example 3: Page Views
View: Roll-Up 2.0 off-campus
Report: All Pages
Time range: Dec. 2015 – April 2016
Y-axis: entrances
X-axis: pageviews
Color: bounce rate
Size: same size
Select: admissions-aid, admissions-aid/apply-now/, admissions-aid/applying-mason/application status
Note big spike in all listed pages on 12/15/2015.
Note application status page was our top landing page on 12/15/2016.
